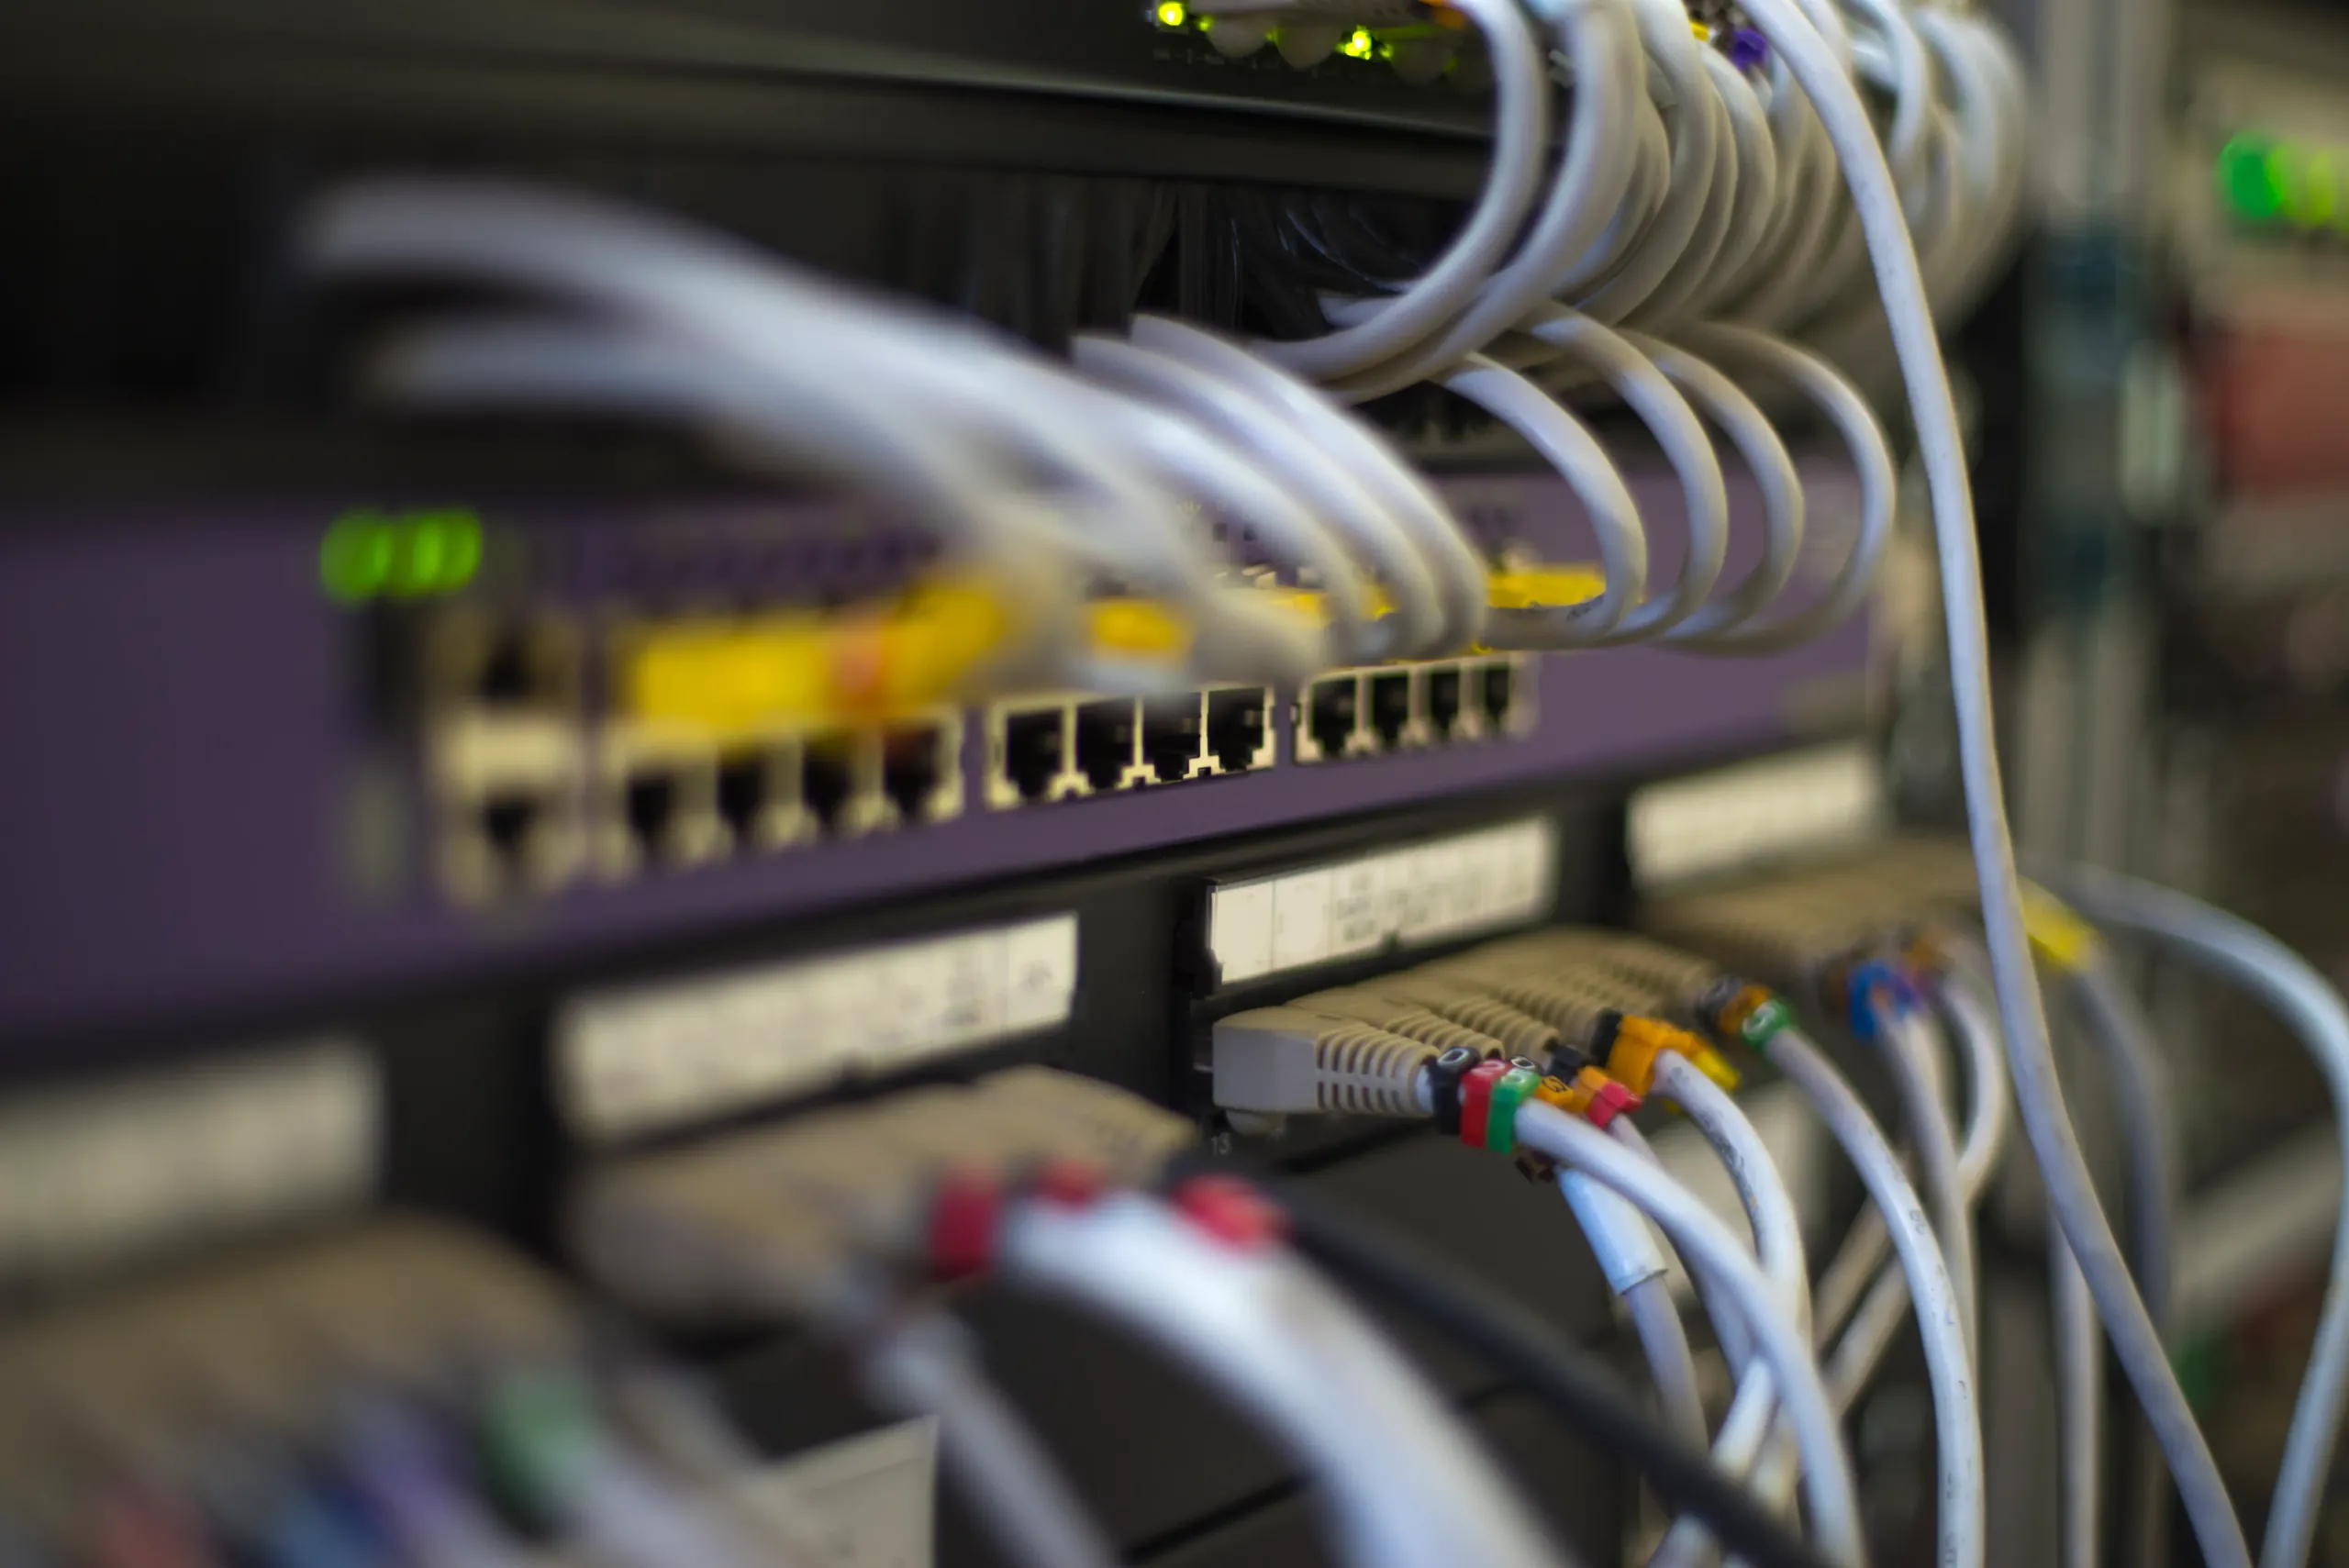
Power management
When, where and how much you use is identified,
cutting power cost and risk
Why it matters
An electricity bill shows a total and a few peaks. It does not show which machine drew that power, at what hour,
or why. Metering sits apart from the records, so when the bill rises the answer is usually an order
to use less rather than a cause. And you only find out you exceeded your contract demand, and owe the demand charge, after the fact.
The data and signals we read
Where the waste hidesHow Refinery solves it
Usage made visible
Equipment, area and time of day are viewed side by side. Once you can see which machine draws how much and when, consumption that felt vague starts to take shape.
Peak management
The moments when several machines run at once and create a peak are found. Staggering start times or splitting the load brings down both contract demand and demand charges.
Abnormal-use detection
Consumption that departs from the usual pattern is caught. Equipment running when it should be off, or standby draw that crept up unnoticed, comes to light.
Power factor and load checks
A falling power factor or load concentrated on one side affects both cost and equipment life. Those points are flagged, along with how much room there is to improve.

Start from a power management template
If this is the first time you are looking at power closely, it is hard to know what to measure and how to read it. The power management template, built up across many sites, already sets out how to structure metering per asset and what thresholds to apply to peaks and power factor. Fill in your own equipment list and contract terms, and you can start looking without designing the structure from scratch.
- Power metering structure by asset and area
- Peak and contract-demand management criteria
- Power factor and load factor dashboard
- Abnormal-use alert rules
Related use cases

Early signs of motor failure are read with wireless vibration sensors, cutting stoppages and losses.

Scattered sensors are brought into one structure and anomalies are read together.

Power quality anomalies you cannot see are caught in real time, and put on the record.

The whole plant’s energy flow is brought into one view, cutting waste and emissions together.
Hidden waste and power peaks are found, and the same work is done for less.
Signals from the process data are read, and defects are caught before the part is finished.
FAQ
What is a power management solution?
Spotting peak demand, abnormal load and falling power factor early reduces both the bill and the risk of an outage.
How does power management differ from an energy management system (EMS)?
Refinery joins power data with EMS and equipment data so the savings it proposes come with evidence.
How does AI help with power management?
Without anyone watching every metric, it flags the moment with the reasoning attached.